
The estimated U.S. rate of violent offenses reported to law enforcement fell from 393.9 per 100,000 people in 2023 to 370.8 in 2024, the Bureau of Justice Statistics reported.
The estimates come from the BJS and FBI National Incident-Based Reporting System Estimation Program. NIBRS collects detailed information about incidents known to participating law-enforcement agencies and the program adjusts those records to produce national estimates.

BJS estimated 1,261,210 violent offenses in 2024, down from 1,319,280 in 2023. Its violent category combines homicide, rape, robbery and aggravated assault.
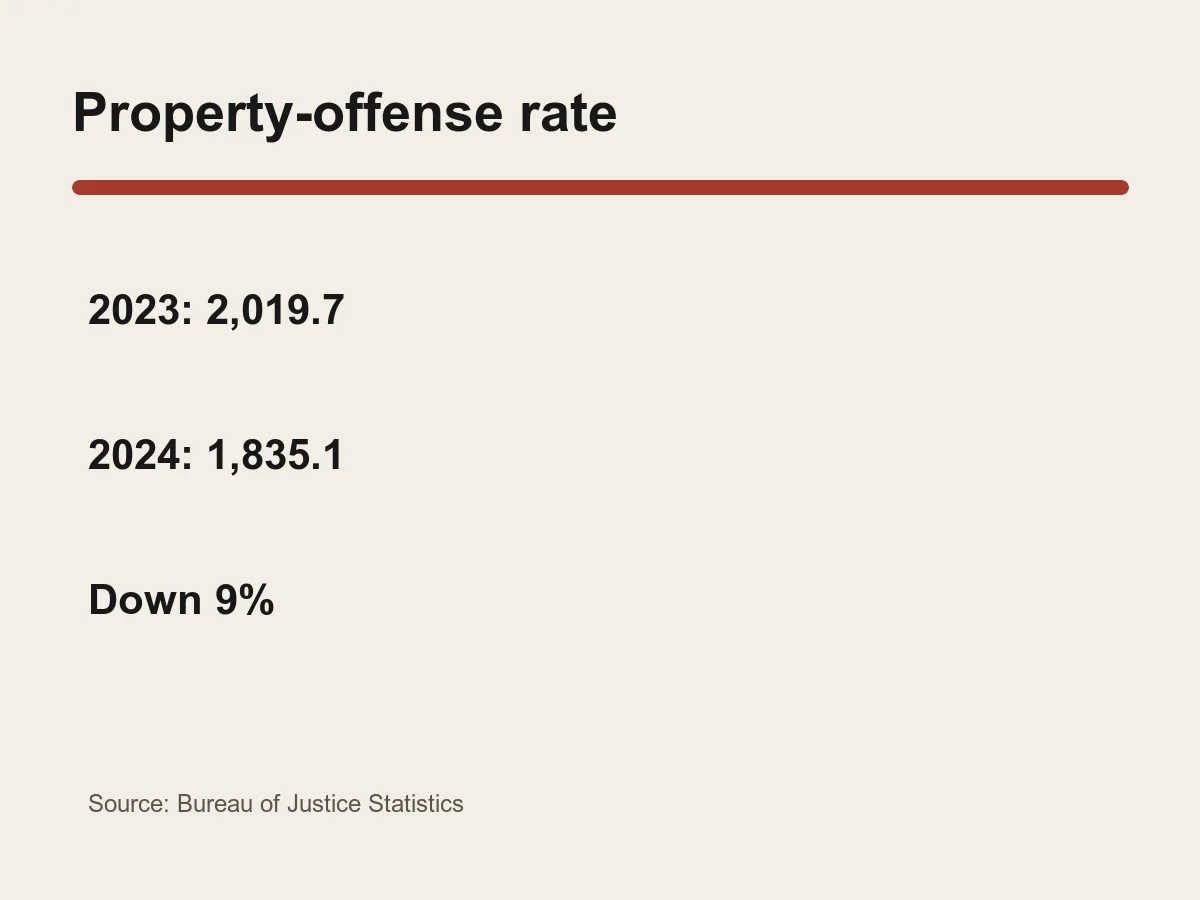
The property-offense rate declined 9%, from 2,019.7 to 1,835.1 per 100,000. Estimated property offenses fell from 6.76 million to 6.24 million.
Within that category, the estimated burglary rate fell from 255.6 to 230.0 per 100,000, larceny-theft from 1,431.9 to 1,334.5, and motor-vehicle theft from 332.2 to 270.6.
The estimated violent-victimization rate was 376.9 per 100,000 in 2024, down from 401.1 in 2023. Offense and victimization rates differ because one incident can involve more than one victim.
BJS also reported decreases in homicide victimization rates for both males and females and lower victimization rates for burglary and larceny-theft.
These figures measure crime known to law enforcement, not every crime that occurred. Reporting behavior, agency participation and estimation methods affect the results, so the series should not be substituted for surveys of unreported victimization.
The 2024 movement is a national estimate and does not describe every city or neighborhood. Local comparisons require consistent agency data and population denominators rather than applying the national change to a specific community.