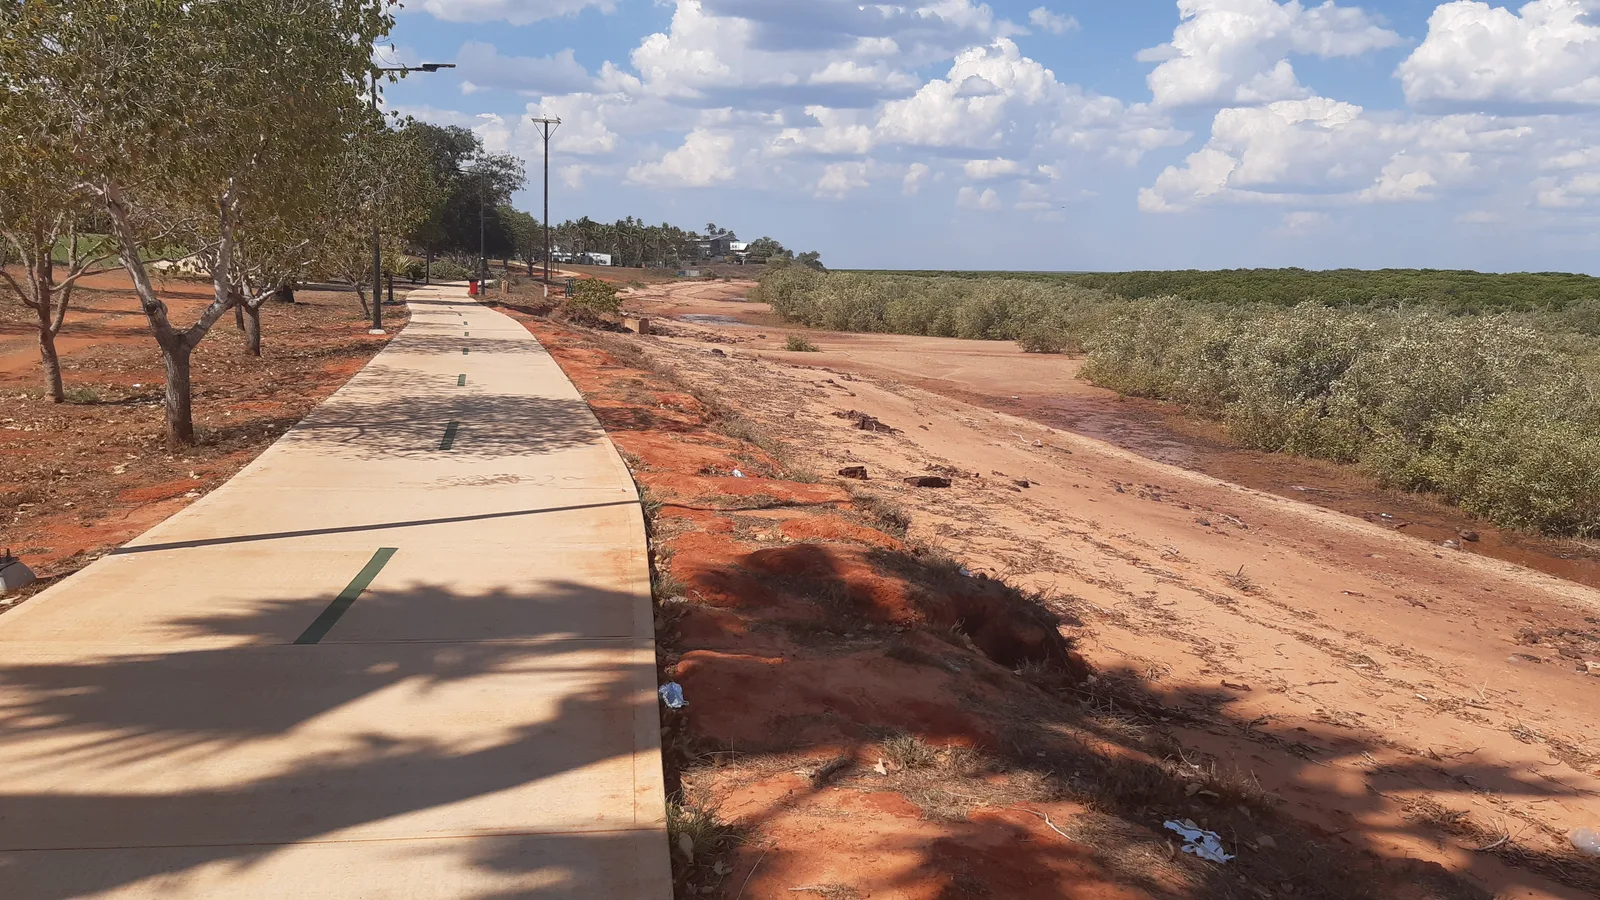
Roebuck Bay on Australia's northwestern coast can experience a tidal range of about 9 meters, or 30 feet, as water moves across a broad, shallow continental shelf, according to a new NASA Earth Observatory feature.
Many other Australian coasts have tidal ranges of 2 meters or less. The comparison describes typical geographic differences; it does not mean every tide at Roebuck Bay reaches the 9-meter maximum.

A Landsat 8 image acquired March 18, 2026, captured the bay near high water. At low tide, extensive mudflats are exposed, producing a rapid transformation visible from shore and from orbit.
The shallow shelf slows and concentrates the incoming tidal wave, helping amplify water-level change inside the bay. Local coastline shape and seafloor depth also influence the timing and height of individual tides.
NASA says mangroves along the western side have expanded at nearly 2 meters per year, based on a study it cites. That is a measured long-term rate for a defined area, not a guarantee of identical growth each year or throughout the bay.
The intertidal flats support dense shellfish and snails, with cited densities reaching 2,500 animals per square meter in some locations. Abundance varies by habitat, season and sampling site.
Hundreds of thousands of migratory shorebirds use the bay and surrounding wetlands. The number is an ecological scale estimate rather than a count tied to the March satellite overpass.
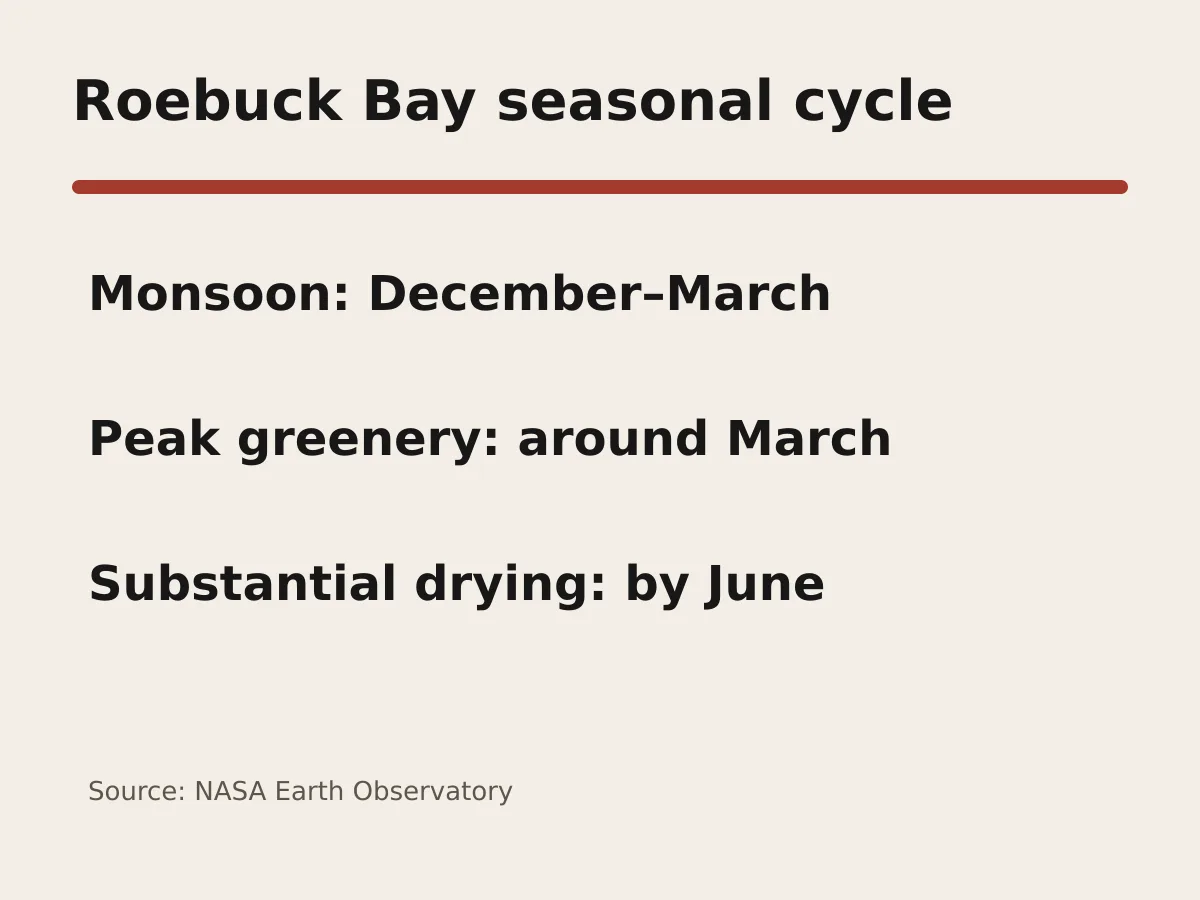
Seasonal rainfall reshapes the landscape beyond the tidal flats. The monsoon generally runs from December through March, vegetation is greenest around March and much of the surrounding country dries by June.
NASA's image connects those tidal and seasonal cycles in one landscape. Continued satellite observations can track shoreline, vegetation and water changes, but they do not replace local tide forecasts or field surveys.