The U.S. Geological Survey has released a machine-learning system that forecasts streamflow drought at more than 3,000 river and stream locations for as long as 13 weeks.
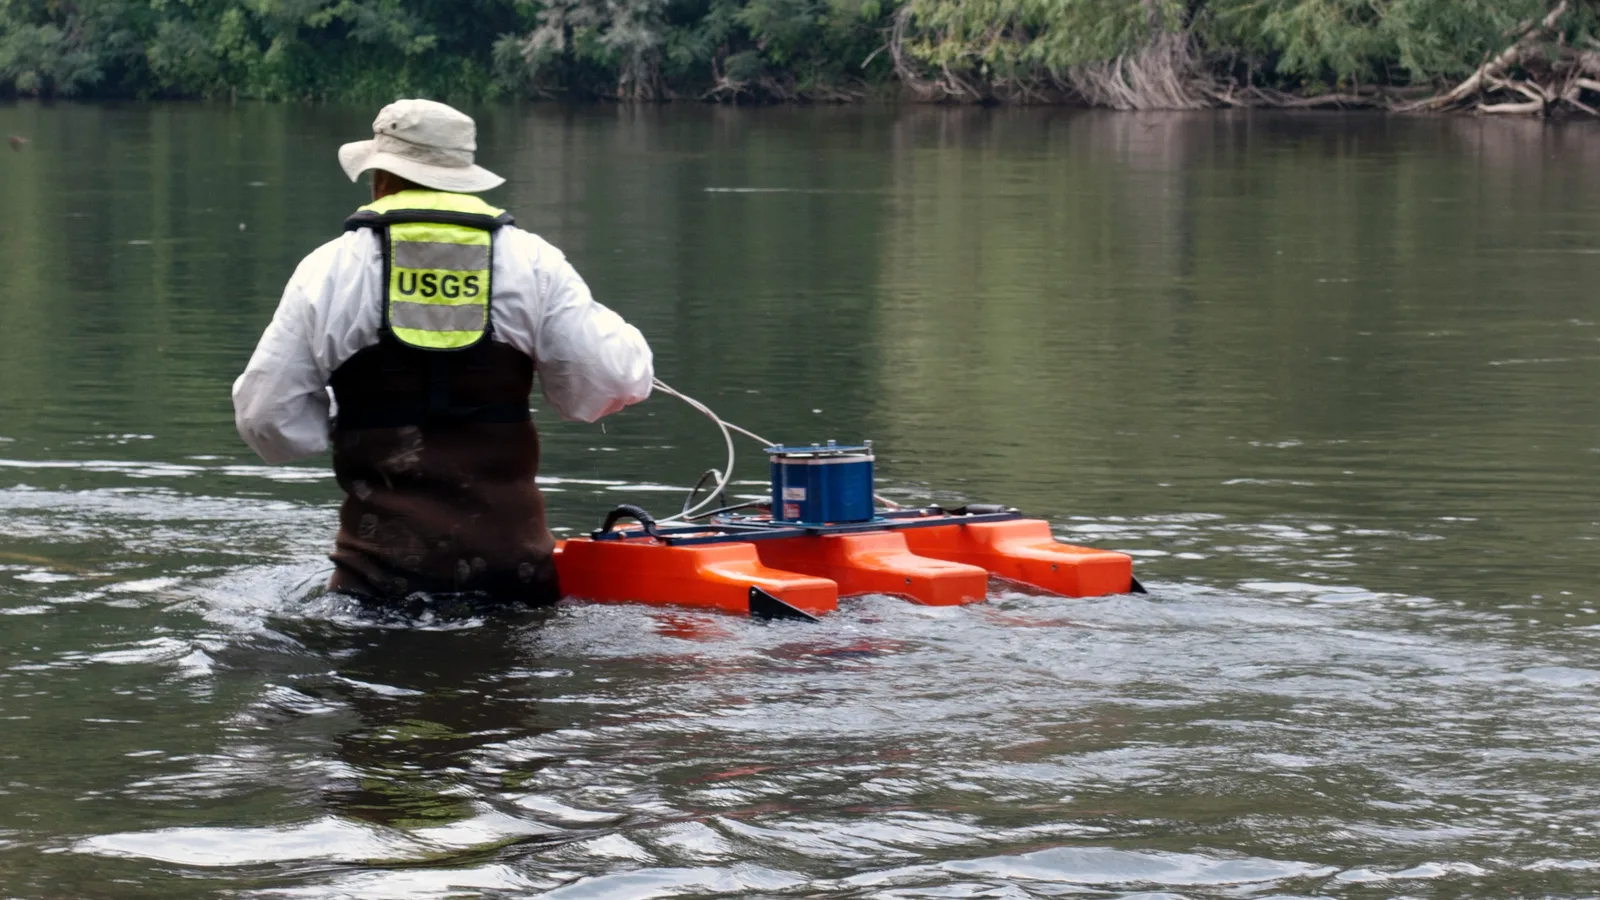
River DroughtCast is trained on data from thousands of USGS streamgages, some with more than a century of continuous records. The public tool covers gages with at least 40 years of data.

Streamflow drought occurs when rivers and streams remain below normal levels for an extended period. It differs from meteorological drought because soil moisture, snowpack and groundwater affect how a rainfall deficit reaches waterways.
Users can select a forecast from one to 13 weeks. USGS says the system is most reliable over the first four to six weeks and includes confidence estimates for each prediction horizon.
The first week of severe or extreme drought is correctly predicted about 75% of the time, according to the agency. Reported reliability falls to about 55% by week 13.
The tool is intended to bridge shorter weather forecasts and seasonal water-supply outlooks. Farmers, municipal water managers and recreation operators could use the added lead time to consider irrigation, conservation or operating changes.

USGS developed River DroughtCast with NOAA's National Integrated Drought Information System. Developers say a future version is intended to expand access into areas without qualifying streamgages and further improve accuracy.
A probabilistic forecast is not a guarantee that a river will cross a drought threshold. Accuracy varies with lead time, local conditions and available historical data, and users should read the confidence information with each forecast.
The operational advance is a nationwide early-warning layer built from long-running public measurements: managers can now inspect weekly low-flow risk months ahead while seeing how forecast confidence declines with time.